How to identify undervalued and overvalued companies: metrics, cases and current trends

“Price is what you pay. Value is what you get.” – Warren Buffett, American investor and entrepreneur.
When price flourishes and value wilts
Fortune’s dream
In the winter of 1636, Jan Van der Velde, a young Amsterdam cloth merchant, sold his store, home, and even his late wife’s wedding ring. To raise the 2,000 guilders, they needed to acquire a Semper Augustus, the most coveted tulip in the Netherlands. Everyone spoke of its incredible value in taverns and markets: one bulb could change lives. Jan did not doubt that this purchase was his ticket to wealth and prestige.
In the auction house, surrounded by nobles and peasants alike, Jan won the bidding. That little bulb, kept in a wooden box, was now his greatest treasure. People came to see it, offering astronomical sums that Jan refused with a smile. “Soon, it will be worth much more,” he thought.
The fall of the market
In January 1637, the rumors began. In Haarlem, a batch of tulips was left without a buyer. Jan, like other speculators, ignored the signs. But the market changed quickly: buyers disappeared, and prices collapsed. When he tried to sell his Semper Augustus, no one wanted to pay for it. “The fad has passed,” he was told.
In a matter of weeks, the bulb that had cost 2,000 guilders was worth nothing. Jan was left without fortune and with a cruel lesson: what he had bought was not wealth but a mirage.
A lesson for modern investors
Semper Augustus symbolizes the disconnect between price and value. Jan learned that when the cost of something depends solely on collective enthusiasm, its actual value can be as fragile as the petals of a flower. This historical episode resonates in modern markets, reminding us that all that glitters is not gold.

The secret formula of a millionaire village
Visionary advice
In the 1920s, in the small town of Quincy, Florida, local banker Mark Welch Munroe, known as “Mr. Pat,” observed a curious phenomenon: even in economic hardship, people could always find a quarter to buy a bottle of Coca-Cola.
Convinced of the company’s potential, Munroe invested in Coca-Cola stock when it went public in 1919 for $40 per share. Although the stock fell to $19 shortly thereafter due to disputes with sugar suppliers and bottlers, Munroe maintained his investment and continued to buy more shares.
Not only did he invest his own money, but he also encouraged his neighbors and customers to do the same. He went so far as to lend money to those who did not have enough capital, advising them to buy Coca-Cola stock and hold it for the long term.
Quincy’s prosperity
Munroe’s vision proved accurate. During the Great Depression, while many companies suffered, Coca-Cola held its sales steady, with a drop of only 2%. With no debt and a strong financial position, the company continued to pay its shareholders dividends, providing Quincy’s investors a steady income.
Over time, Coca-Cola’s stock increased significantly in value. It is estimated that at least 67 Quincy residents became millionaires thanks to these investments, and the town became known as the richest in the United States regarding wealth per capita.
Lessons from a successful investment
The story of Quincy and “Mr. Pat” Munroe highlights the importance of recognizing a company’s intrinsic value beyond market fluctuations. While Coca-Cola’s stock price experienced ups and downs, the actual value of the company, based on its strength and the product’s popularity, continued to grow.
This story illustrates how informed investment and patience can transform lives and entire communities, highlighting the duality between the market price and the actual value of a company.

The value-price duality: what you pay and what you get
One fundamental but often misunderstood concept in the investment world is the relationship between price and value. These two terms, which seem synonymous, represent, in practice, completely different realities. Confusion between the two has led to fortunes and ruin, as illustrated by the cases of the tulip bubble and Quincy’s vision.

What is the price?
The price of a stock is simply the monetary amount that investors are willing to pay at a given time in the market. This number, visible on any stock exchange or financial application, reflects real-time supply and demand dynamics. However, it does not always tell the whole story.
Factors influencing price:
- News: quarterly results, management changes, product launches.
- Market trends: collective optimism or pessimism.
- Speculation: The thrill of “not being left out”(FOMO).
- External events: economic crises, regulatory changes, or natural disasters.
The price can soar on a fad or plummet due to irrational fears. In both cases, it does not always reflect a company’s proper health or potential.
What is intrinsic value?
Intrinsic value is a more stable and rational measure. It represents what a stock is worth based on the fundamentals of the company: its earning power, its assets, its competitive advantage, and its future in the marketplace. Determining intrinsic value is not simple; it requires analysis, tools, and, often, a dash of vision.
Methods for calculating intrinsic value:
- Discounted cash flow (DCF): calculates the present value of expected future cash flows.
- Book value: Sum of assets minus liabilities.
- Financial ratios: Indicators such as PER (Price to Earnings Ratio) or EV/EBITDA.
- Qualitative analysis: assessment of competitive advantage, quality of the management team, and market position.
Intrinsic value is a solid benchmark, but it is not an exact science; it depends on assumptions about the future that may or may not be met.

The price-value gap: market inefficiency
If markets were perfectly efficient, the price of a stock would always match its intrinsic value. But the reality is different. Emotions, lack of information, or herd behavior can create significant discrepancies.
1. Overvaluation:
- When the price of a share exceeds its intrinsic value.
- Example: The tulip bubble or fashion stocks during the technology boom. Don’t forget that when everyone is buying, it may be time to consider selling.
Undervaluation:
- When the price of a share is below its intrinsic value.
- Example: Coca-Cola’s actions in its early days or companies ignored during a crisis. Remember that every situation is an opportunity.
These market inefficiencies are what savvy investors look for. Buying when the price is below value and selling when it is above is the essence of successful investing.

The role of emotions and trends
Psychology plays a crucial role in the differences between price and value:
- Euphoria: In times of boom, investors tend to overvalue assets, ignoring risks. Example: The dot-com boom in the 1990s.
- Panic: In times of crisis, prices plummet, even for solid companies. Example: The market crashed in 2008.
Like Warren Buffett, great investors advise going against the grain: “Be fearful when others are greedy and greedy when others are fearful.” This approach allows you to take advantage of market inefficiencies to find opportunities.
Recent examples
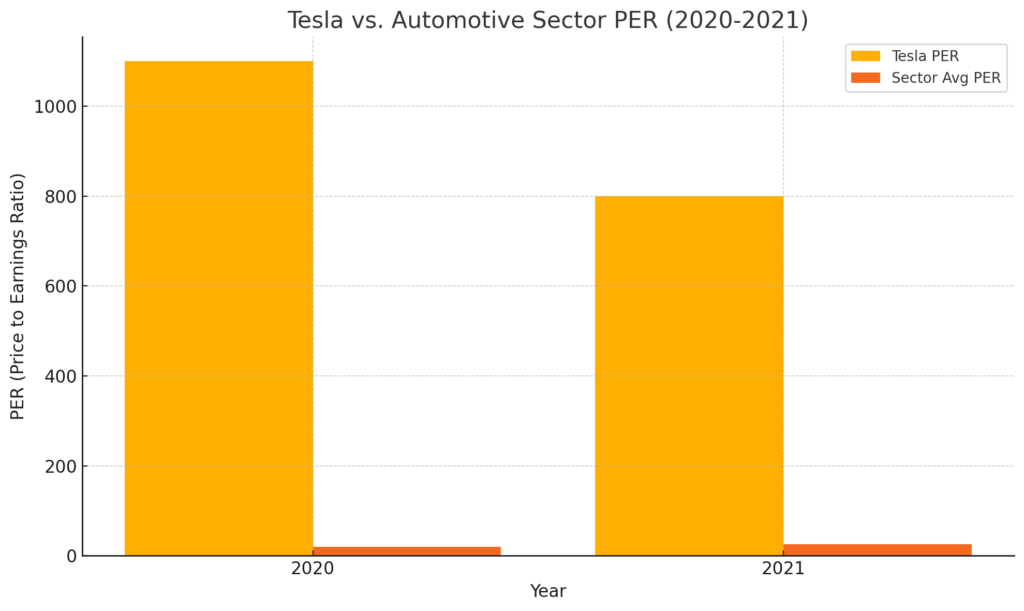
1. Overvaluation case: Tesla (2020-2021)
During the market boom of 2020-2021, Tesla’s stock reached sky-high valuations relative to its traditional financial metrics. Although the company had impressive growth, its P/E (price-to-net income ratio) reached very high levels, reflecting enormous speculation.
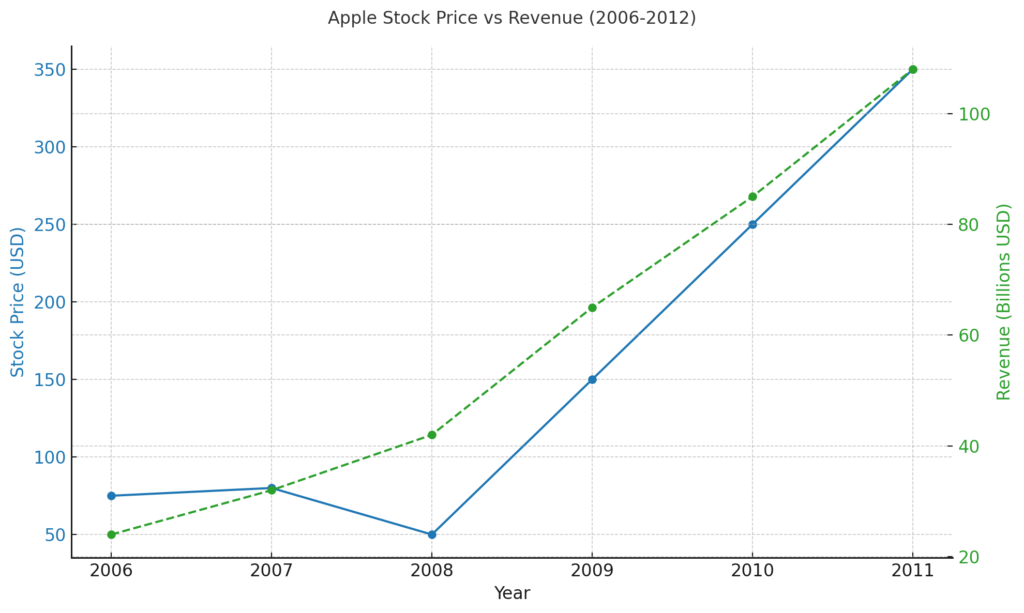
2. Case of undervaluation: Apple (2008)
2008, during the financial crisis, Apple’s stock fell sharply, even though the company was launching revolutionary products such as the iPhone—investors who could see its intrinsic value reaped huge returns over the long term.
Metrics for assessing fair price
Valuing a company requires tools that translate financial data into useful decision-making information. While not infallible, standard metrics are critical to identifying whether a stock is overvalued, undervalued, or fairly valued. Here, we will explore the main metrics classified by their approach.
Revenue-based metrics
a) PER (Price to Earnings Ratio)
- Definition: ratio between share price and net earnings per share (EPS).
- Interpretation
- High P/E: may indicate overvaluation or expectations of high future growth.
- Low P/E: may indicate undervaluation or problems in the company.
- For example, a P/E of 25 means that investors are willing to pay $25 for every dollar of profit.
b) PEG (Price/Earnings to Growth)
- Definition: adjustment of the P/E according to the expected net income growth.
- Interpretation
- PEG < 1: la acción puede estar infravalorada en relación con su crecimiento.
- PEG > 1: could be overvalued.
- Example: a company with a P/E of 20 and 10% growth has a PEG of 2, indicating possible overvaluation.
2. Asset-based metrics
a) P/B (Price to Book Ratio)
- Definition: the ratio between share price and book value per share.
- Interpretation
- P/B > 1: investors are paying more than the company’s book assets are worth.
- P/B < 1: la empresa puede estar infravalorada.
- Ideal for asset-intensive sectors such as banking or manufacturing.
3. Metrics based on cash flows
a) EV/EBITDA (Enterprise Value / Earnings Before Interest, Taxes, Depreciation, and Amortization)
- DefinitionEnterprise Value (EV) to EBITDA ratio. Let’s break down each term that appears in the formula to understand it fully:
- The Enterprise Value (EV) considers both its market capitalization and net debt. It is calculated as the Market Capitalization + Total Debt – Cash and Cash Equivalents.
- Market Capitalization: It is obtained by multiplying the current share price by the total number of shares outstanding.
- Total Debt: Includes the company’s financial obligations, such as short and long-term loans.
- Cash and Cash Equivalents: Represents cash and liquid assets held by the company.
- EBITDA (Earnings Before Interest, Taxes, Depreciation, and Amortization) measures a company’s operating profitability, excluding financial expenses, taxes, and non-cash items such as depreciation and amortization. It is calculated by adding interest, taxes, depreciation, and amortization to net income.
- The Enterprise Value (EV) considers both its market capitalization and net debt. It is calculated as the Market Capitalization + Total Debt – Cash and Cash Equivalents.
- Interpretation
- Low EV/EBITDA: may indicate undervaluation.
- High EV/EBITDA: may reflect overvaluation or strong expected growth.
- Example: handy for comparing companies in the same sector.
b) FCFF (Free Cash Flow to the Firm)
- DefinitionMeasures the cash flow available to all providers of capital (shareholders and creditors) after covering operating and investment expenses. Let’s break down each term that appears in the formula to understand it fully:
- EBIT (Earnings Before Interest and Taxes): represents the profits generated by the company before deducting interest (payments to creditors) and taxes. It is a measure of the company’s operating profitability.
- T: the company’s effective tax rate (e.g. 25% or 0.25).
- (1 – T) Tax adjustment: this term adjusts EBIT to reflect the taxes that the company must pay on its operating income.
- EBIT (1 – T): Net Operating Profit After Taxes(NOPAT).
- Depreciation: expense associated with the wear and tear of tangible assets (buildings, machinery, etc.).
- Amortization: expense associated with consuming intangible assets (patents, software, etc.).
- Depreciation and Amortization are added to the FCFF calculation formula because these items do not affect the available cash flow; they are accounting adjustments.
- CAPEX (Capital Expenditures): represents investments in capital goods necessary to maintain or expand the company’s operations, such as purchasing machinery, buildings, or technology. These investments are actual cash outflows that decrease available cash flow.
- Change in Working Capital: Working capital (WC) is the difference between the company’s current assets (cash, accounts receivable, and inventory) and current liabilities (obligations maturing in less than one year). The change in working capital measures how many resources are allocated to the company’s operation. A reduction in Working Capital frees up cash for other needs. An increase in Working Capital implies that the business needs more resources.
- Interpretation
- Positive and growing FCFF: a good sign for financial health.
- Negative FCFF: This may be of concern except in expanding companies.
Practical example
Let’s analyze the key financial metrics of Apple Inc (AAPL) using recent actual data. These metrics will help us evaluate the company’s valuation from different perspectives. The share price is USD 248.05 (as of December 19, 2024).
Revenue-based metrics
a) PER (Price to Earnings Ratio)
Fact: Net earnings per share: USD 6.08.
Result:
Interpretation:
A P/E of 40.81 indicates that investors pay $40.81 for every dollar of Apple’s earnings, suggesting high expectations for future growth.
b) PEG (Price/Earnings to Growth)
Fact: Expected EPS growth (5-year estimate): 12% (0.12).
Result:
Interpretation:
A PEG of 3.40 suggests that, although Apple has a high P/E, expected earnings growth is not commensurately high, which could indicate some overvaluation in its current price.
2. Asset-based metrics
a) P/B (Price to Book Ratio)
Fact: Book value per share: $3.77 USD
Result:
Interpretation:
A P/B of 65.86 indicates that investors pay $65.86 for every dollar of Apple’s book value, reflecting a valuation well above book value, which is standard in companies with substantial intangible assets and brands.
3. Metrics based on cash flows
a) EV/EBITDA (Enterprise Value / Earnings Before Interest, Taxes, Depreciation, and Amortization)
Data:
- Enterprise Value (EV): $3.79 billion USD.
- EBITDA (last 12 months): $134.66 billion USD.
Result:
Interpretation:
An EV/EBITDA of 28.16 suggests that investors value Apple at 28.16 times EBITDA, which may indicate a high valuation compared to other companies in the sector.
b) FCFF (Free Cash Flow to the Firm)
Data:
- EBIT (last 12 months): $123.22 billion USD.
- Tax Rate (T): 24.09% (0.2409).
- Depreciation and Amortization: $11.44 billion USD (estimated as the difference between EBITDA and EBIT)
- CAPEX (Capital Expenditures): $9.45 billion USD.
- Change in Working Capital: USD 2.5 billion (estimated).
Calculations:
- EBIT after taxes:
- Add Depreciation and Amortization:
- Subtract CAPEX:
- Subtract the change in Working Capital:
Result:
Interpretation:
This value indicates that Apple generates significant free cash flow, reflecting its strong ability to fund operations, invest in growth, and return capital to shareholders.
Influence of the economic sector
The financial metrics used to value a company vary significantly depending on the economic sector in which it operates. Below, we group the main economic sectors according to the most appropriate valuation method and highlight the peculiarities of each group.
1. High-growth sectors
- Sectors Included: Technology, Health, Communications.
- High growth expectations: These types of companies usually innovate constantly, which generates accelerated growth expectations.
- Most appropriate valuation metrics:
- PER (Price/Earnings): High, reflecting confidence in future growth.
- PEG (Price/Earnings about growth): Useful for adjusting the PER according to the expected growth rate, providing a more balanced valuation.
- Peculiarities:
- Volatility: Greater sensitivity to market changes and technological advances.
- R&D investment: Significant research and development expenditures that may affect earnings in the short term.
2. Stable income sectors
- Sectors Included: Utilities, Real Estate, Defensive Consumption.
- Predictable cash flows: Constant demand for essential products and services.
- Most appropriate valuation metrics:
- EV/EBITDA: It assesses the capacity to generate consistent cash flows.
- P/B: This is especially relevant in real estate due to the importance of tangible assets.
- Peculiarities:
- Regulation: Subject to government regulations that may influence their profitability.
- Slower growth: More modest growth rates compared to technology sectors.
3. Cyclical sectors
- Sectors Included: Industry, Commodities, Energy, and Cyclical Consumption.
- Sensitivity to the economic cycle: Its performance is closely linked to economic cycles.
- Most appropriate valuation metrics:
- P/E: Indicates valuations at different stages of the economic cycle.
- FCFF: Useful for analyzing the company’s ability to remain liquid during low economic cycles.
- Peculiarities:
- Price volatility: Prices can fluctuate significantly, especially in commodities and energy.
- Capital investment: High capital expenditures to maintain and expand operations.
4. Financial sector
- Sectors Included: Financial Services.
- Interest rate dependence: Earnings are influenced by changes in interest rates.
- Most appropriate valuation metrics:
- P/B: Evaluate whether the company is adequately valued regarding its tangible assets.
- EV/EBITDA: Measures the capacity to generate net income adjusted for debt and equity.
- Peculiarities:
- Strict regulation: Highly regulated, which may limit certain operations and affect profitability.
- Credit risk: Exposure to the risk of default by borrowers.
Summary table
| Sector group | Sectors included | Key metrics | Peculiarities |
| High growth | Technology, Health, Communications | PER, PEG | Innovation, high P/E, high future growth. |
| Stable income | Utilities, Real Estate, Defensive Consumption | EV/EBITDA, P/B | Predictable cash flows financial stability. |
| Cyclical | Industry, Commodities, Energy, Cyclical Consumption | PER, FCFF | Sensitivity to the economic cycle, price volatility. |
| Financial | Financial Services | P/B, EV/EBITDA | Exposure to interest rate and credit risks. |
Grouping sectors by key metrics facilitates a tighter and more accurate assessment of corporate valuation. While industries such as technology stand out for using P/E and PEG, more stable sectors such as utilities focus on metrics related to cash flows, such as EV/EBITDA. Tailoring the analysis to the specific industry is critical to making informed and successful investments.

Current alternatives to traditional metrics
In a world where technology is advancing rapidly, traditional company valuation methods are being complemented or challenged by modern approaches. Classic metrics, such as P/E or EV/EBITDA, remain fundamental, but new market dynamics and the specific characteristics of certain sectors have prompted more sophisticated and contextual alternatives.
Models based on alternative data
The availability of large volumes of data has revolutionized how we analyze an enterprise’s value. Among the most prominent approaches are:
Sentiment analysis in social networks
It uses social media, forums, and news platform data to gauge public sentiment toward a company or product. For example, sentiment on forums such as Reddit directly impacted prices during the rise of “meme” stocks such as GameStop. The aim is to predict stock price movements based on positive or negative trends or to identify potential entry or exit points in volatile markets.
ESG Metrics (Sustainability)
It evaluates environmental, social, and governance factors (Environmental, Social, Governance) as part of a company’s valuation. For example, companies such as Tesla are valued not only for their financial metrics but also for their leadership in sustainability. The aim is to identify companies with sustainable practices that can attract long-term investors and mitigate risks associated with environmental regulations or governance scandals.
2. Application of Artificial Intelligence to company valuation.
The incorporation of artificial intelligence (AI) in financial analysis has opened up new possibilities for estimating the intrinsic value of companies:
Machine Learning Models
They use large historical and real-time data sets to predict intrinsic values. They have a remarkable ability to identify complex patterns that are not obvious to human analysts. In addition, they allow the inclusion of multiple variables, such as macroeconomic data, consumer behavior, and global trends. For example, a machine learning model could combine traditional financial indicators with social media data and ESG metrics to generate a more complete valuation.
Predictive Analytics
They anticipate events such as changes in stock prices based on historical data and probabilistic analysis. This approach makes it possible to identify scenarios of a company’s overvaluation or undervaluation and adjust investment strategies in real-time.
3. Adjustments for startups and disruptive companies
Traditional metrics lose relevance in sectors such as technology or biotechnology, where companies can operate for years without generating significant revenues. Alternative approaches come into play here:
Metrics based on growth and potential:
- Cash burn rate: Evaluate how much cash the company consumes regarding its ability to raise more funds.
- User adoption rate: Measures the growth of the customer or user base, a key indicator for technology startups.
- Market projections: Estimates the total size of the target market and the company’s potential market share.
Disruptive valuation models
They focus on innovation and scalability rather than current revenues. For example, Startups like Uber or Airbnb were initially valued for their ability to transform industries, even before reaching profitability.

Conclusions
Investing, in its purest essence, is not just a matter of numbers; it is an act of interpretation. Throughout this analysis, we have explored how classic metrics, economic sectors, and current trends interact in an intricate game that separates price from value. These are the keys that every investor should remember:
- Price vs. value: The cost of a stock is visible and tangible, but tinged by emotion and speculation. On the other hand, value is deep, structural, and often hidden under layers of uncertainty. Differentiating between the two is the first step toward sound investment decisions.
- Metrics: Standard metrics, such as PER or EV/EBITDA, are reliable compasses but not complete maps. Each number must be read in context, interpreted critically, and complemented with modern, alternative approaches.
- Context matters: The valuation of a technology startup cannot be judged by the same metrics as a utility company. Understanding the economic sector where each company operates, its peculiarities, and its cycles is critical to avoid costly mistakes.
- The age of alternative data: In a world where social media sentiment analysis can move markets and ESG metrics are redefining corporate sustainability, investors have more tools than ever to look beyond the obvious.
A final thought
In financial markets, mirages are common. Often, what glitters most brightly is not gold but a bubble about to burst. In this context, I leave you with this question:
“Are you investing in companies for what they are worth or what others say they are worth?”
Successful investing requires more than formulas or algorithms; it demands a combination of curiosity, rigor, and, above all, patience. Ultimately, it’s not about guessing the next market move but building solid wealth on fundamental foundations.

References for further information
Books
- “The Little Book of Business Valuation“ by Aswath Damodaran.
This book provides an accessible guide to valuation techniques, including case studies and practical examples to improve your valuation skills.
- “Company valuation: How to measure and manage value creation“ by Pablo Fernández.
A work that helps the reader to value any company or investment project, identifying the most relevant factors in the value creation process.
- “Business valuation: a theoretical and practical guide to valuing companies“ by José María Revello de Toro Cabello. This book provides a theoretical and practical guide to business valuation, useful for professionals and students in the financial field.
- “Company valuation and value-based management“ by
Alfonso Rojo Ramírez. A work that addresses the valuation of companies and value-oriented management with a practical and updated approach.
- “Valuation of Start-Ups and Growing SMEs: How to estimate their value step by step with solved examples“ by Juan Pérez-Carballo Veiga.
This book estimates the value of startups and small and medium-sized growing companies, offering a step-by-step approach with practical examples.
These books can be found on Amazon in their paper version, in their version for Kindle version, or as an audiobook for a subscription to Audible.
The links above are affiliate links, meaning if you decide to purchase them, the blog will receive a small commission at no additional cost. This partnership helps keep the content free, informative, and quality.
Online articles
- Company valuation: methods for its calculation and cases in which it is performed. This Actualícese article provides a detailed overview of the various business valuation methods, including when and how to apply them.
- Company valuation: conventional approaches and new trends. Published in Harvard Deusto, this article explores traditional methods and emerging trends in business valuation.
- An approach to financial valuation methodologies. This academic study in SciELO analyzes the primary methods used in economic valuation, highlighting their applications and limitations.
- The valuation of companies in Spain: an empirical study. This AECA document presents an empirical analysis of how company valuations are carried out in Spanish.
- Importance of EBITDA in the valuation of companies. This article by Giménez-Salinas Abogados delves into how EBITDA indicates how companies are valued.
Videos on YouTube
Legal Notice
The content of this article is purely informative and purely informative and educational. It does not constitute financial, tax, or legal advice. Before making any investment decision, we recommend you consult a qualified professional who can look at your personal and economic situation. Investments involve risks; the investor is responsible for analyzing and assuming those risks.